
Viewing Logs Through Crafter Studio
Various log files are created when running CrafterCMS. This section details the logs available for viewing through Crafter Studio.
Audit Logs
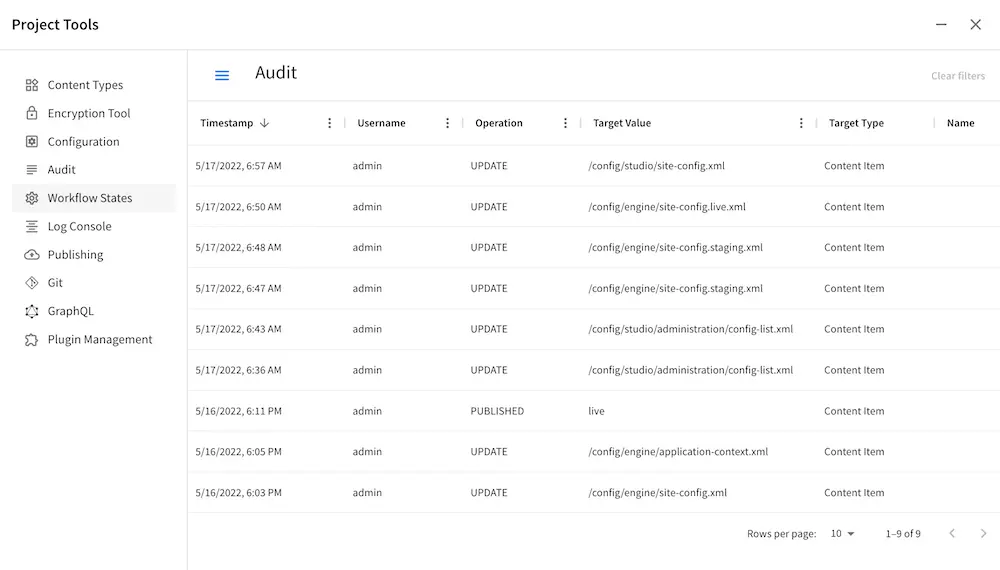
CrafterCMS tracks the date, time, user and action performed to content through an audit log.
To view the audit logs, from the Sidebar, click on ![]() , then click on Audit
, then click on Audit
Log Console
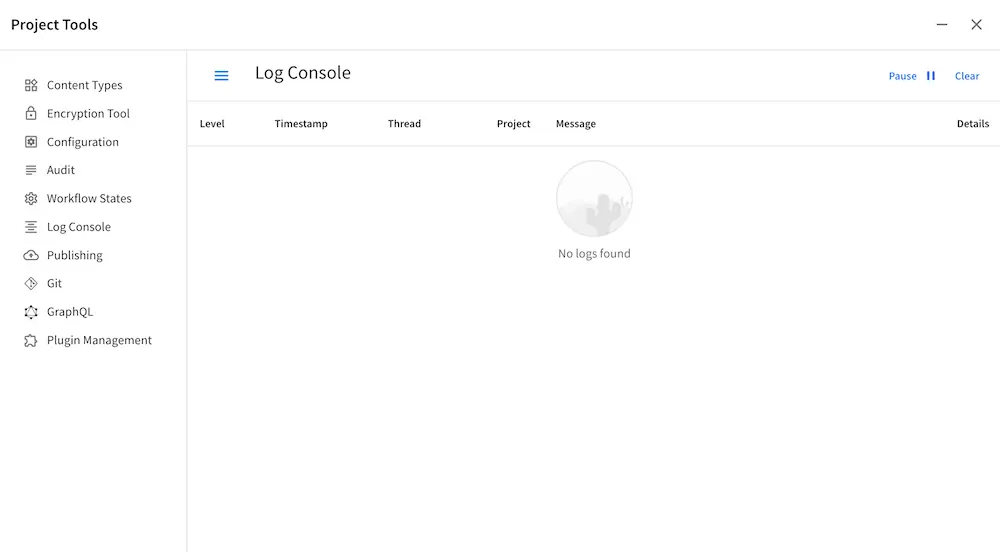
CrafterCMS has a Log Console that allows you to view messages depending on what log levels and what Java packages have been set for tracking.
To view logs in Crafter Studio, click on ![]() from the Sidebar, then click on Log Console. Looking inside the Log Console, messages we want to display are setup beforehand. The messages displayed in the Log Console depends on what levels are set for the Java packages being run in CrafterCMS.
from the Sidebar, then click on Log Console. Looking inside the Log Console, messages we want to display are setup beforehand. The messages displayed in the Log Console depends on what levels are set for the Java packages being run in CrafterCMS.
There are 7 log levels defined in CrafterCMS. These levels determine what messages will be logged and displayed in the Logging Console. Below are the 4 log levels available from the lowest to the highest:
all: turns on all logging
trace: displays informational events tracing the path of code execution in a program
debug: displays things useful for debugging
info: displays informational messages like progress of the application, etc
warn: displays potentially harmful situations that might cause problems
error: displays anything that may be fatal to the operation/causes a problem
off: turns off all logging
The lower your logging levels are set, the more verbose your logs will be.
We’ll now go to the Log Console to start viewing the logs. From the Sidebar, click on ![]() -> Log Console. To start viewing the logs, click on Play/Pause at the top to start viewing the log files
-> Log Console. To start viewing the logs, click on Play/Pause at the top to start viewing the log files
For more information on logging levels, see Overriding Logging Levels