
Debugging Search Issues
How Search Works
Flow
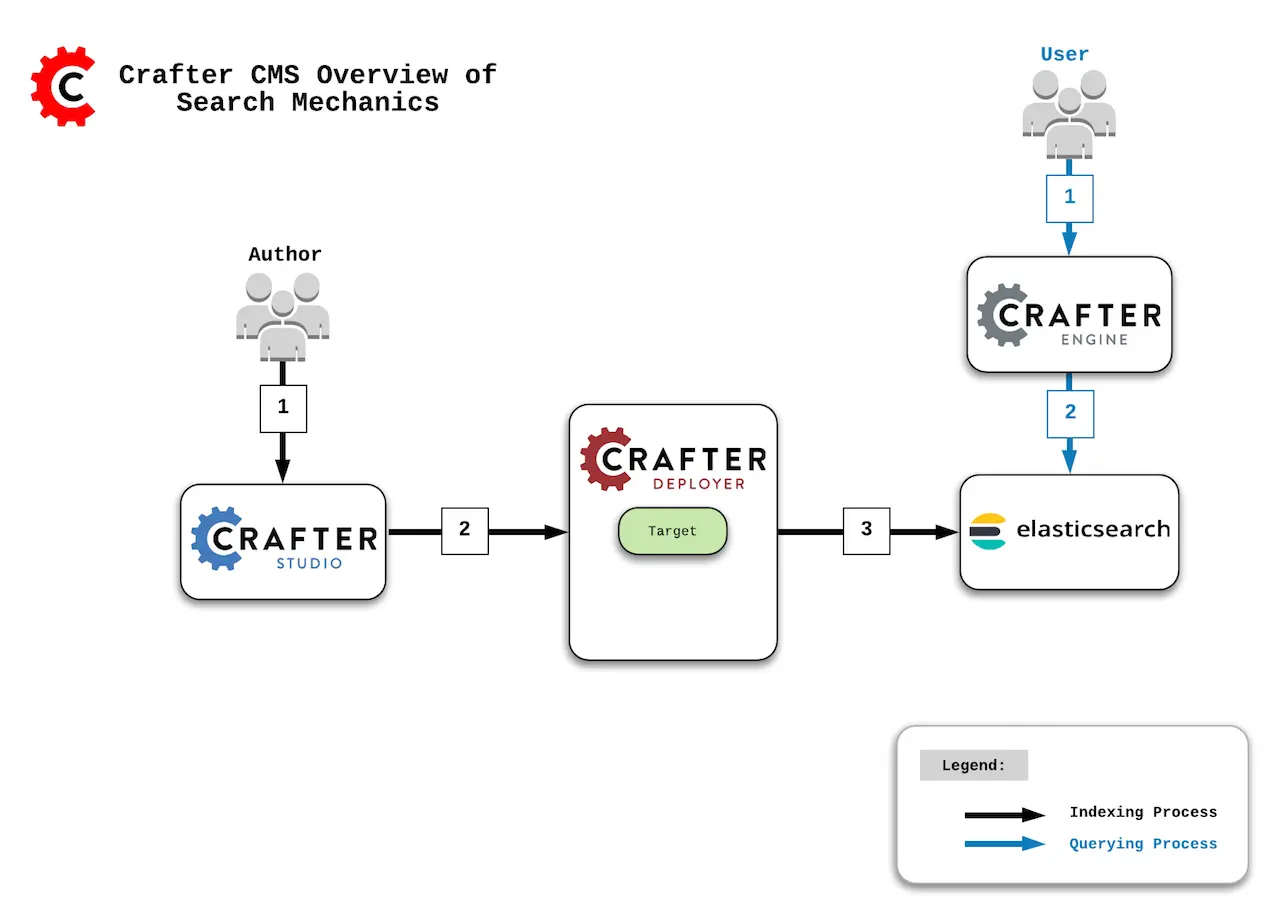
Indexing Process:
Author updates content in Crafter Studio.
Studio notifies the Deployer of the changes in a particular target (which is the combination of site/environment). Then:
On preview update, the Deployer inspects the
sandboxand resolves the changes by doing a file diff between the last Git commit it processed and the latest commit in thesandbox.On publish, Studio moves the changes to
publishedand the Deployer in delivery pulls the changes.
A processor of the target in the Deployer sends a request to Elasticsearch with the XML or content to index.
Querying Process:
The end user makes a page or service request to Crafter Engine.
Crafter Engine components requiring queries issue a query to Elasticsearch where simple filters will be added to the query and then executed.
Places Search Indexing Can Get Hung Up
Communication Between Crafter Studio & Crafter Deployer
Crafter Studio will notify the Deployer when content has changed.
Ensure that the Deployer is pulling the changes.
If the Deployer is not receiving any changes, check network connectivity and ports.
Communication Between Crafter Deployer & Elasticsearch
The Deployer has a target with a Search Processor.
Ensure that the processor is configured to the proper HOST, PORT for Elasticsearch.
Communication Between Crafter Engine & Elasticsearch
Crafter Engine is configured to talk to Elasticsearch
Ensure that Crafter Engine is configured to the proper HOST, PORT for Elasticsearch.
Reviewing Log Files
In order to figure out which of the possible failures described in the previous section happened, you should review the following log files for each one of the components:
Component
|
Log Files
|
|---|---|
Crafter Studio
|
CRAFTER/logs/tomcat/catalina.out |
Crafter Deployer
|
CRAFTER/logs/deployer/deployer.outCRAFTER/logs/deployer/deployer-general.logCRAFTER/logs/deployer/{target}-{env}.log |
Elasticsearch
|
CRAFTER/logs/elasticsearch/elasticsearch.log |
Crafter Engine
|
CRAFTER/logs/tomcat/catalina.out |
Configure Deployer Port & Elasticsearch Port
CRAFTER/bin/crafter-setenv.sh
export DEPLOYER_PORT=${DEPLOYER_PORT:="9191"}

export ES_HOST=${ES_HOST:="localhost"}
export ES_PORT=${ES_PORT:="9201"}
Elasticsearch Storage Monitoring
Please note the following default behavior of Elasticsearch monitoring the available storage:
Will not allocate shards to nodes that have more than 85% disk used (only affects clusters not single instances)
Will attempt to relocate shards away from a node whose disk usage is above 90% (only affects clusters, not single instances)
Enforces read-only on every index that has one or more shards allocated on the node that has at least one disk exceeding 95% (affects any intance)
When an index is set as read-only the application log will show messages similar to this one
Caused by: ElasticsearchStatusException[Elasticsearch exception [type=cluster_block_exception, reason=blocked by: [FORBIDDEN/12/index read-only / allow delete (api)];]]
In the Elasticsearch log the following message will be shown:
[2019-04-02T16:10:14,520][WARN ][o.e.c.r.a.DiskThresholdMonitor] [uKHC0qA] flood stage disk watermark [95%] exceeded on [uKHC0qAFSrWZguNmsWhFiQ][uKHC0qA][INSTALL_DIR/data/indexes-es/nodes/0] free: 10.5gb[4.5%], all indices on this node will be marked read-only
For more information on the Elasticsearch disk-based shard allocation, see https://www.elastic.co/guide/en/elasticsearch/reference/current/disk-allocator.html for reference